

Monitoring AI Activity
The Activity Monitor shows what your AI agents are doing. Every agent run is captured as a session: the models it used, the tools it called, the services behind those tools, the person who drove it, and anything a policy blocked. You can browse sessions at a glance, then open one to see it as a graph or as a full conversation.
Open it from Agentic → Activity Monitor in the sidebar.
The point is attribution. Agents act semi-autonomously and reach real systems through tools, so when something happens you need to trace it back: which agent, driven by which person, reached which resource through which tool, and in what context. The Activity Monitor gives you that lineage. It is not about watching employees use an LLM, it is about holding autonomous agents accountable for what they do.
The sessions dashboard
Section titled “The sessions dashboard”The dashboard lists every AI session in the selected time window. Use the time-range control (top right) to switch between the last 1 hour, 6 hours, 24 hours (the default), or 7 days, and the refresh button to reload. Queries are capped at the last seven days.
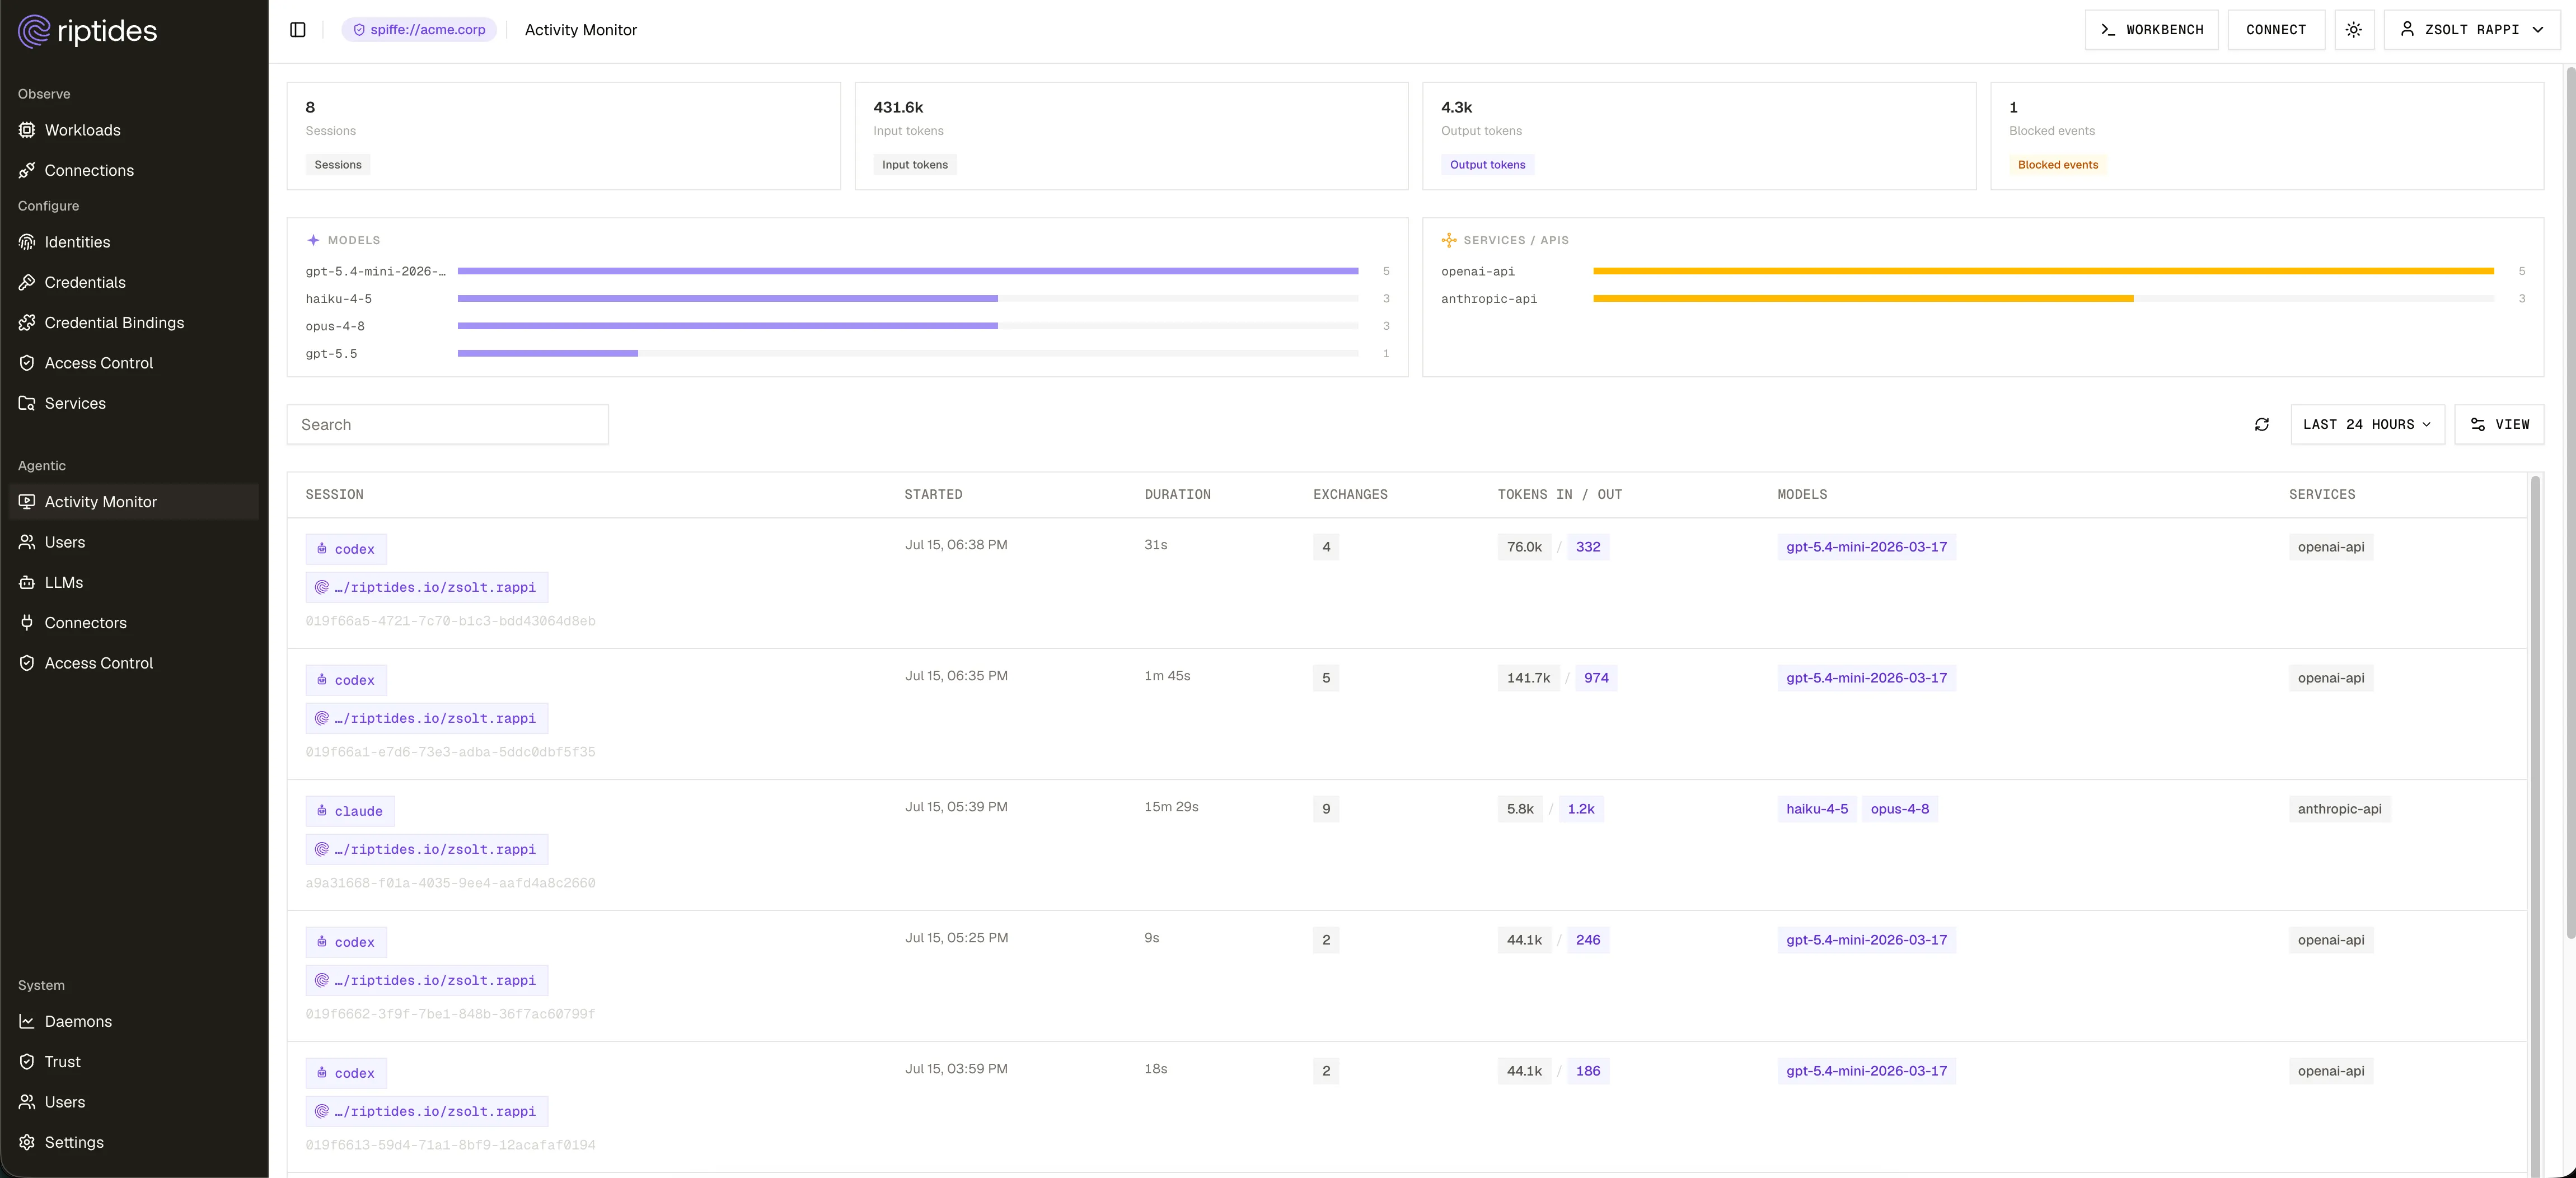
At the top, four cards summarize the window:
- Sessions: how many agent runs occurred.
- Input tokens and Output tokens: total token usage across all sessions.
- Blocked events: how many models or tools were blocked by policy.
Below the cards, two usage panels rank the most-used Models and Services / APIs in the window.
The table lists the sessions themselves. Each row shows:
- Session: the agent’s workload identity (for example
claudeorcodex), the person who drove it, and the session id. Sessions that contained blocked activity are flagged. - Started and Duration: when the run began and how long it lasted.
- Exchanges: how many request/response turns the agent had with an LLM.
- Tokens in / out: token usage for the session.
- Models: the models the agent used.
- Services: the MCP services it reached.
Search by the person driving the session, and click any row to open it.
Opening a session
Section titled “Opening a session”A session opens in a side panel with a summary strip (exchanges, input and output tokens, duration, and start time), plus a thinking indicator when the agent used reasoning and a blocked indicator when policy stepped in.
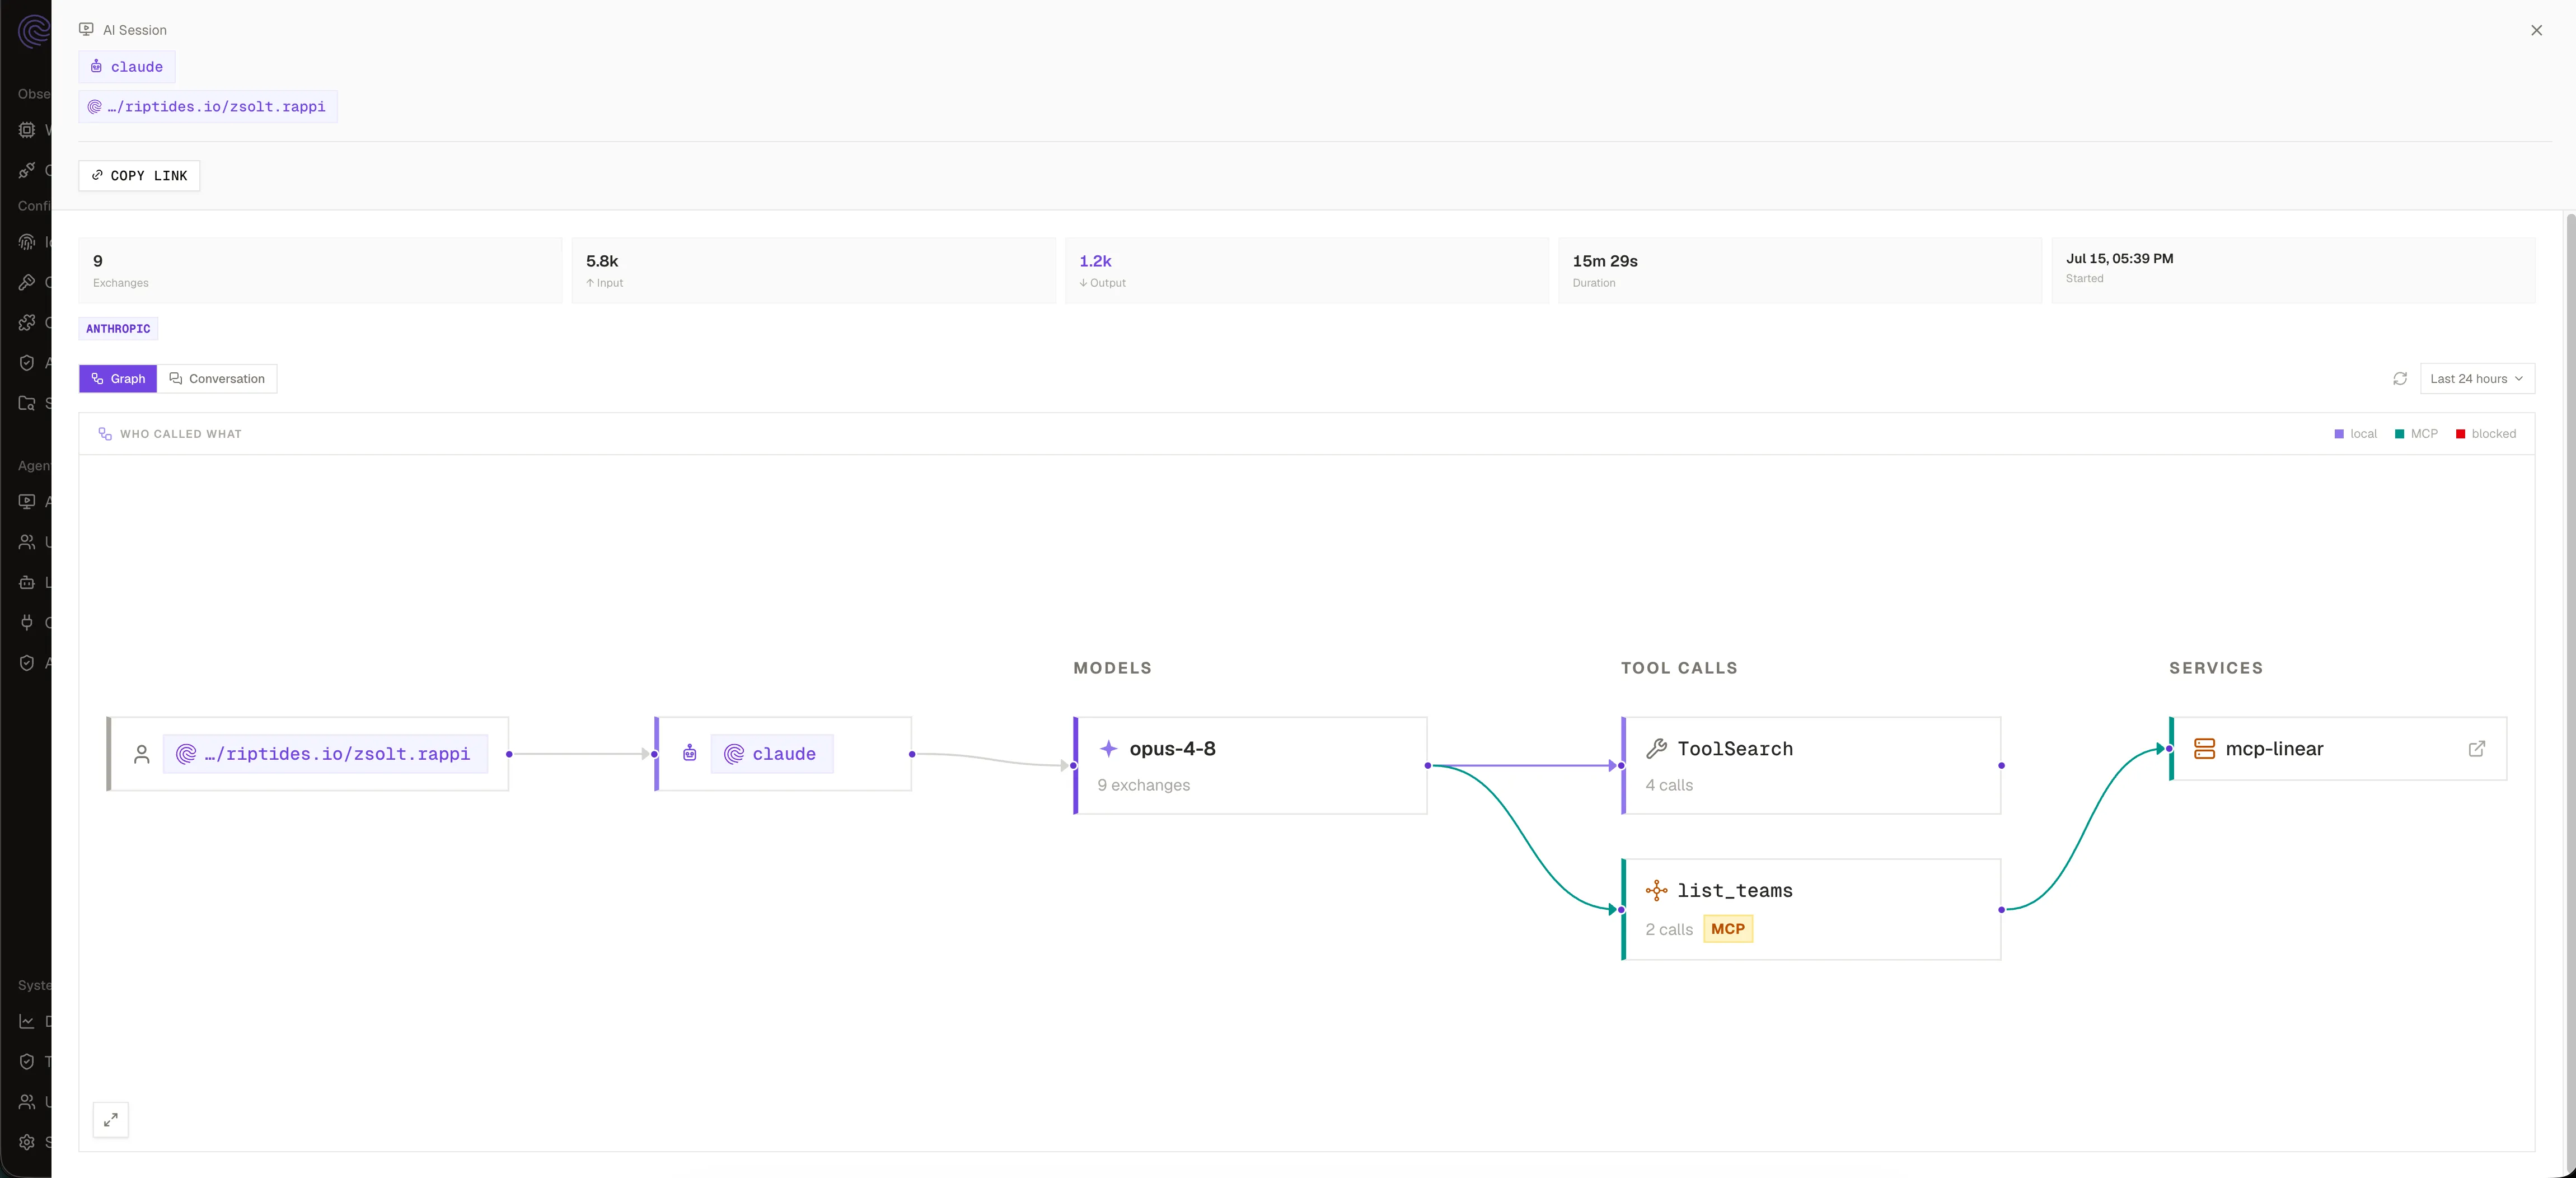
You can view the session two ways, using the toggle at the top of the panel:
- Graph (the default): a visual map of what the agent talked to.
- Conversation: the full turn-by-turn transcript.
The session graph
Section titled “The session graph”The graph reads left to right, in five columns:
- Who: the person who drove the agent.
- Workload: the agent identity that made the calls (for example
claude). - Models: each model the agent used. A spawned sub-agent gets its own node, badged with the sub-agent it belongs to.
- Tool calls: each distinct tool the agent invoked. MCP tools are badged MCP; built-in tools show as local tools.
- Services: the registered service behind an MCP tool call (the same entity you see in Service Inventory). Only MCP tool calls have a service.
Focusing on a path
Section titled “Focusing on a path”Click any node to focus it. The graph highlights that node’s full lineage, everything upstream and downstream of it, and dims the rest, so you can isolate, say, one model and just the tools it called.
Use Reset zoom to fit the whole graph again.
Node details
Section titled “Node details”Clicking a model or a tool node opens a detail drawer on the right:
- Tool drawer: the tool name, whether it is an MCP or local tool (and which server), the total number of calls, and how many were blocked. Below that is every call, newest first: when it happened, which model made it, and, for each call, its input (arguments) and output (result). Blocked calls are marked as blocked.
- Model drawer: the model name, the sub-agent it belongs to (if any), the number of exchanges, and how many were blocked, followed by one row per exchange.
Trace a block to its policy
Section titled “Trace a block to its policy”When a model or tool is blocked, the detail drawer marks that call as blocked. Note the session’s workload identity and who was driving it, then open Access Control for that agent and select the matching Autonomous Operation or user policy. From there you can adjust the allowlist if the block was not what you intended.
The conversation view
Section titled “The conversation view”Switch to Conversation to read the session as a transcript. Prompts appear as chat bubbles, the person’s messages on one side and the model’s responses on the other, with reasoning (“thinking”) shown separately and tool calls as expandable rows that reveal their arguments and results. Blocked tool calls are marked.
By default the transcript focuses on the interesting parts and collapses routine turns; toggles let you show all exchanges, include system prompts, and fold background sub-agent activity into groups. Use the search box to find a specific message.
Next steps
Section titled “Next steps”- Control agent access: turn what you saw into a policy that allows only the models and tools you intend.
- Manage LLMs and Connectors: review the providers and MCP servers agents can reach.